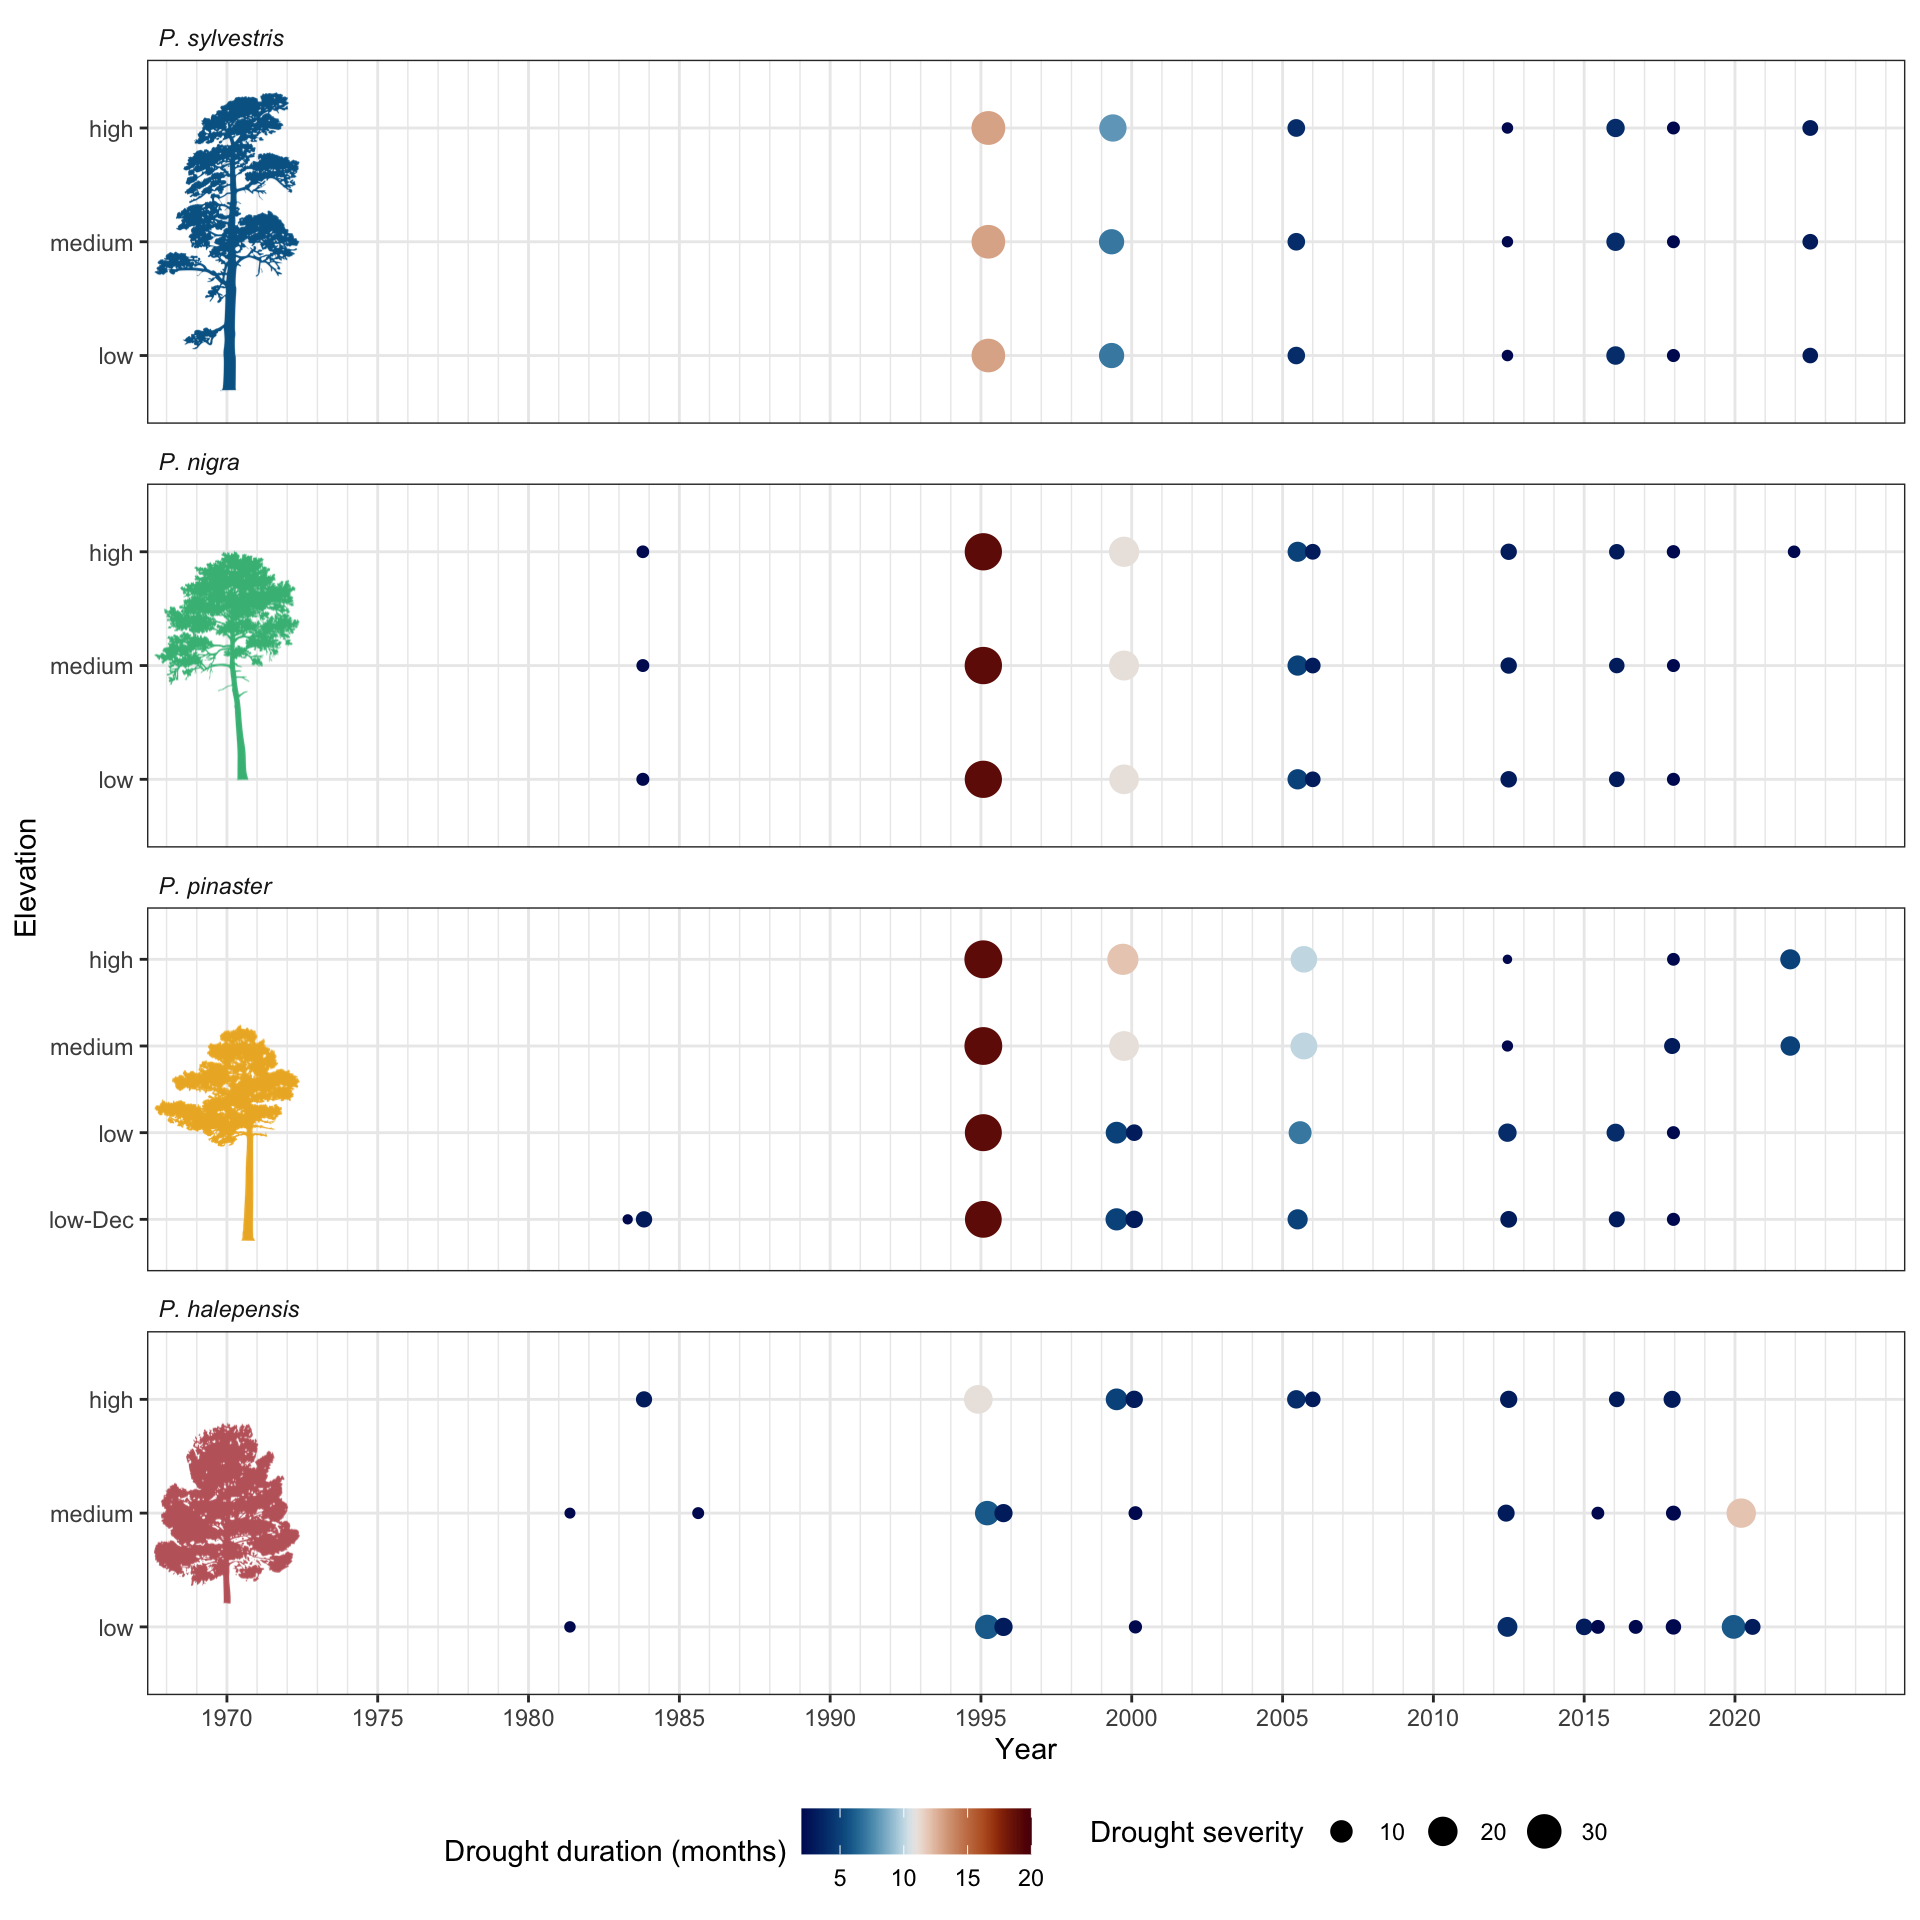
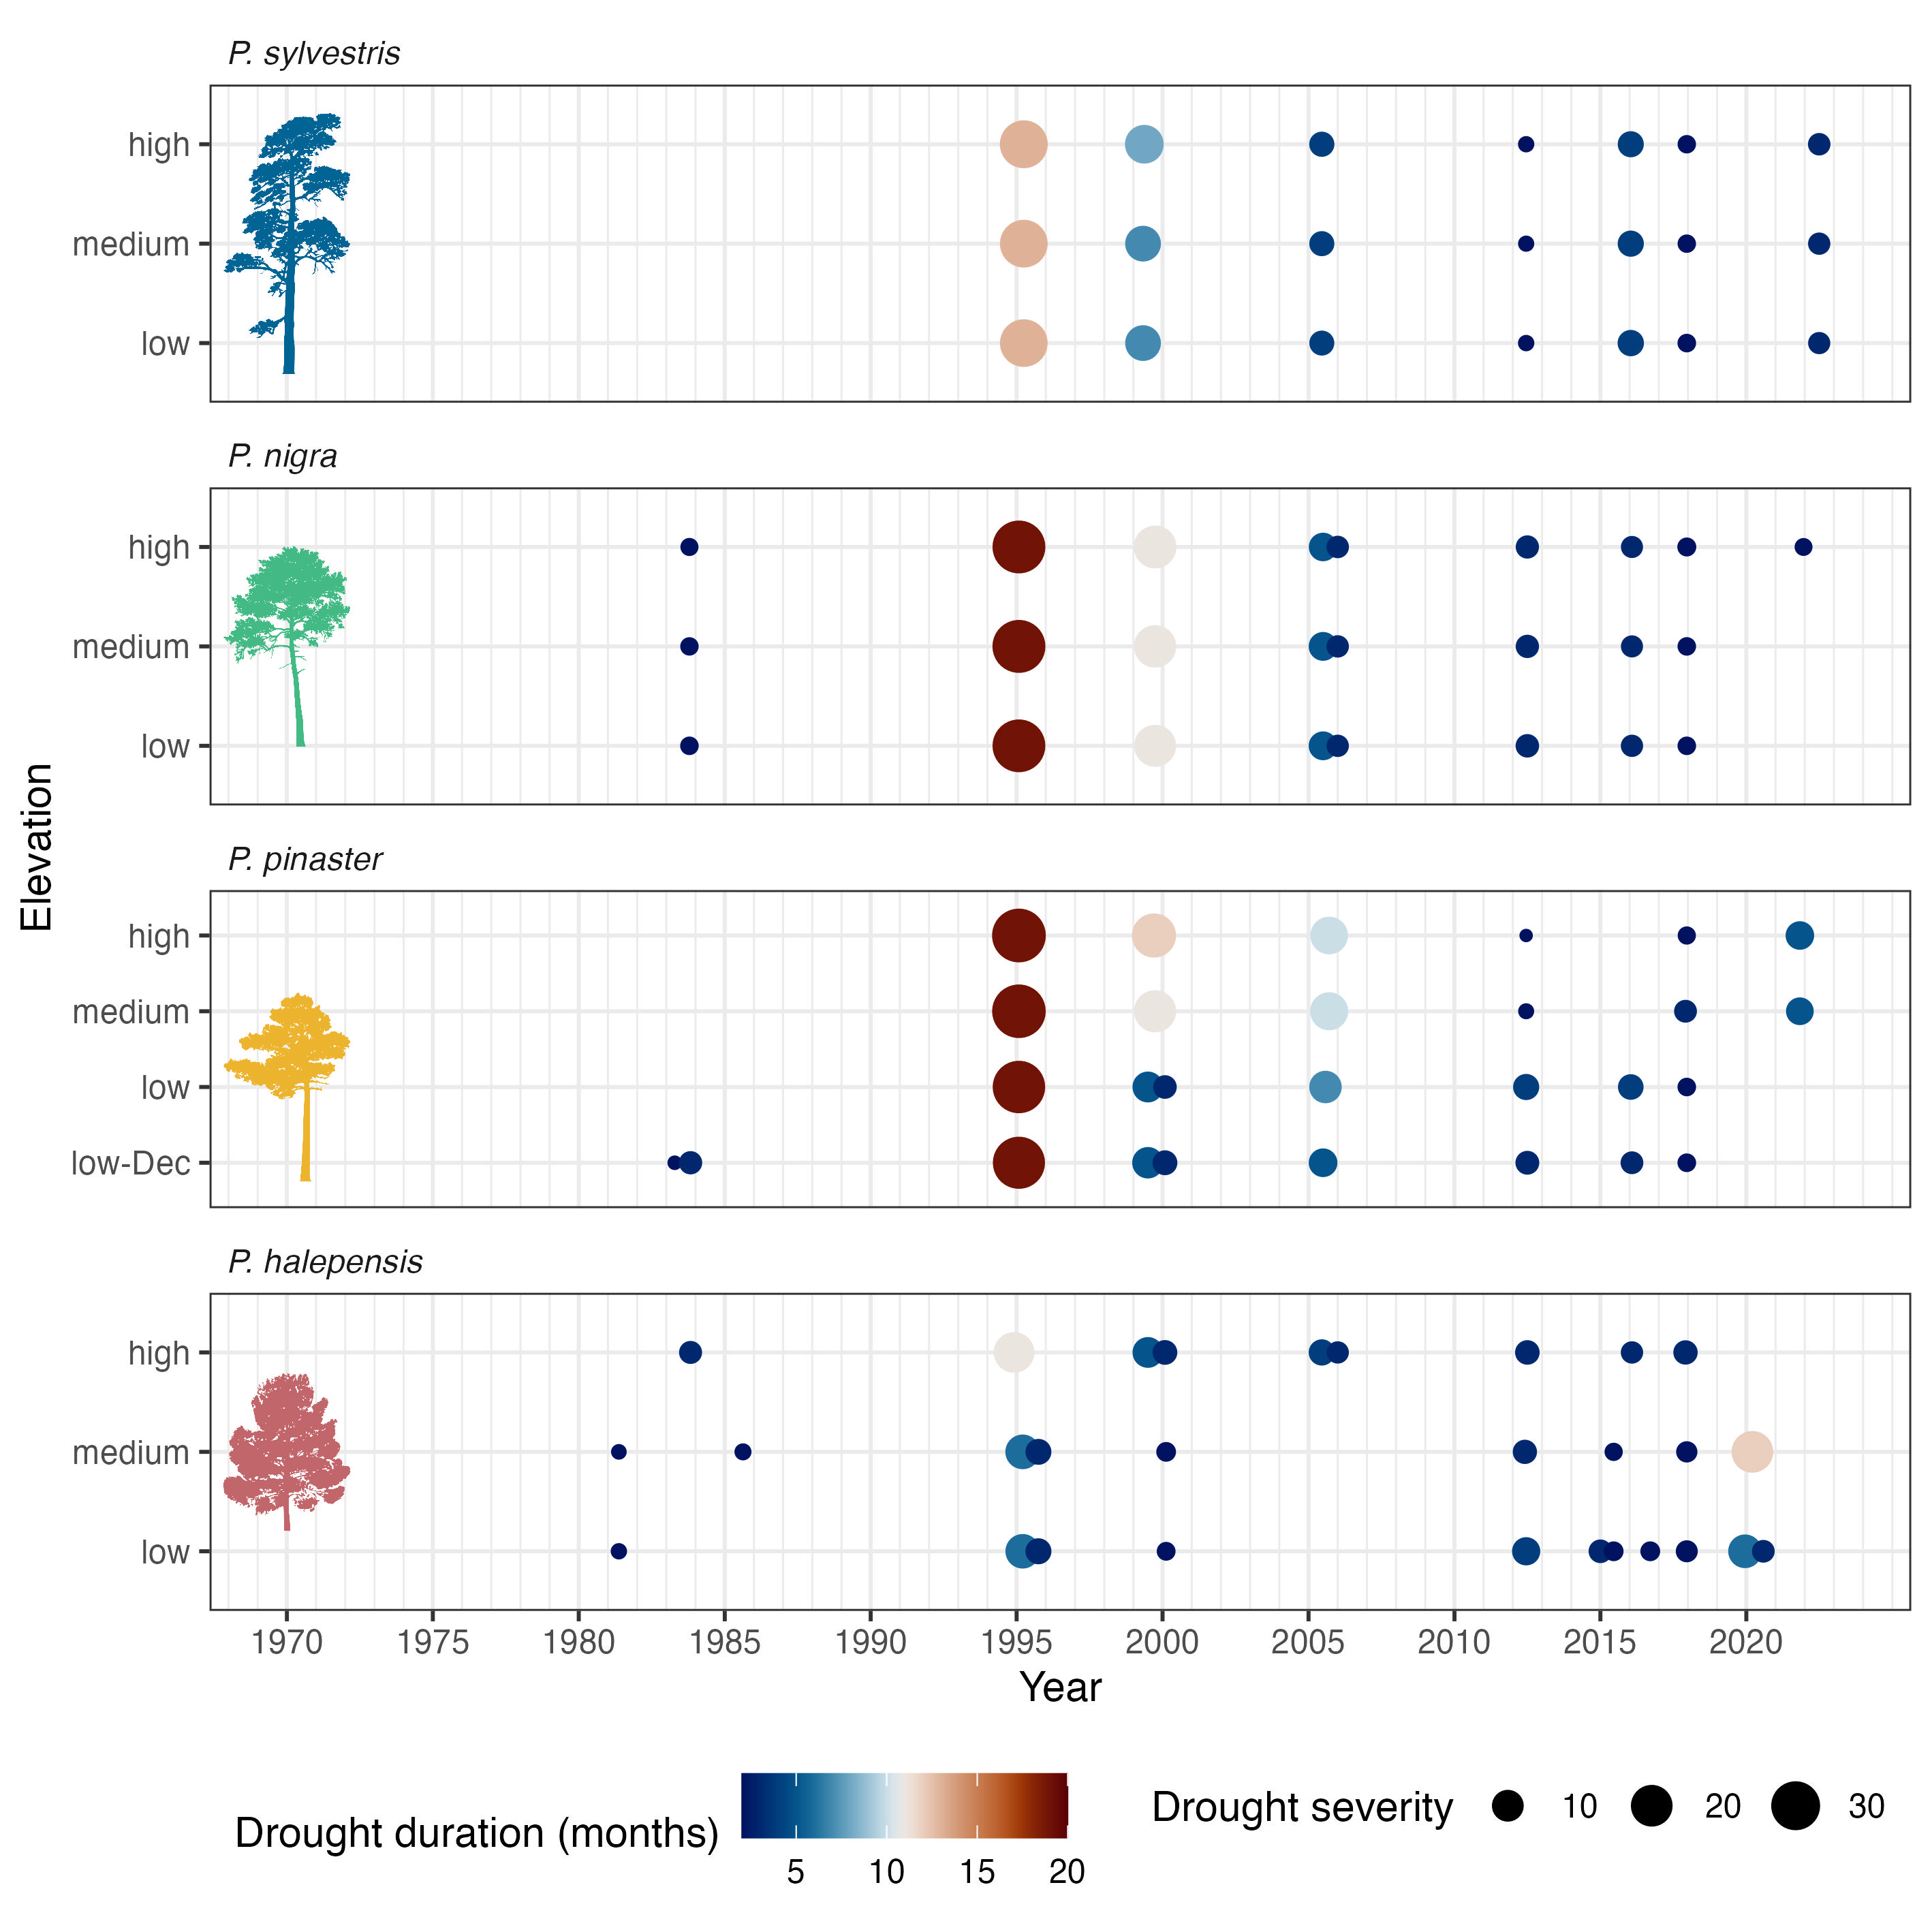
Drought events calculated from the SPEI drought index (12-month scale) for the period 1980-2023 at the study sites. Each dot represents a severe drought event. Dot size is proportional to the drought severity. Drought severity was estimated as the sum of the absolute SPEI values during the drought period.
Source Code
---title: "Drought events"format: html: toc: falseexecute: message: false warning: false---- This figure corresponds to figure S3 in the manuscript.- An high-resolution version of this figure is available [here](../output/plot_drouhgts.jpg).### Figure ```{r}#| code-fold: true#| fig-cap: "Drought events calculated from the SPEI drought index (12-month scale) for the period 1980-2023 at the study sites. Each dot represents a severe drought event. Dot size is proportional to the drought severity. Drought severity was estimated as the sum of the absolute SPEI values during the drought period." #| fig-width: 10#| fig-height: 10library(tidyverse)source("../scripts/aux.R")library(Kendall)library(trend)library(scico)# Read spei dataspei_data <-read_csv("../data/spei_climate.csv")# Select spei06 y spei12 datas <- spei_data |> dplyr::select(sp_elev, year, month, spei06, spei12) |>pivot_longer(c(spei06, spei12), names_to ="spei") |>filter(!is.na(value))spei_events <- s |>group_by(spei, sp_elev) |>nest() |>mutate(drought_results = purrr::map(data, ~droughtIndicators(., "value", -1.28)$drought_assessment)) |>unnest(drought_results) |>select(-data)d <- spei_events |>separate(rangeDate, into =c("minmonth", "maxmonth"), remove =FALSE) |>unite("start_date", minyear, minmonth, sep ="-", remove =FALSE) |>unite("end_date", maxyear, maxmonth, sep ="-", remove =FALSE) |>mutate(start_date =as.Date(paste0(start_date, "-01"), format ="%Y-%b-%d")) |>mutate(end_date =as.Date(paste0(end_date, "-01"), format ="%Y-%b-%d")) |>rowwise() |>mutate(middate = (start_date + ((end_date - start_date) /2)))#### Drought events SPEI-12d12 <- d |>filter(spei =="spei12") |>ungroup() |> dplyr::select(sp_elev, d_duration, d_intensity, d_severity, lowest_spei, month_peak, start_date, end_date, middate) |>separate(sp_elev, c("sp_code", "elev_code"), sep ="_", remove =FALSE) |>mutate(species =paste0("P. ", sp_code))image_data <-data.frame(species =c("P. sylvestris", "P. nigra", "P. pinaster", "P. halepensis"),elev_code =c("medium", "medium", "low", "medium"),middate =ymd("1970-01-01"),img =c("../data/images/sylvestris.png", "../data/images/nigra.png", "../data/images/pinaster.png", "../data/images/halepensis.png") )plot_droughts <- d12 |>mutate(elev_code =fct_relevel(elev_code, "low-Dec", "low", "medium", "high")) |>ggplot(aes(y = elev_code)) +geom_point(aes(x = middate, y = elev_code, size = d_severity, color = d_duration)) +labs(size ="Drought severity", x ="Year", y ="Elevation") +facet_wrap(~factor(species, levels =c("P. sylvestris", "P. nigra", "P. pinaster", "P. halepensis")), ncol =1, scales ="free_y") +theme_bw() + ggimage::geom_image(data = image_data,aes(x = middate, y = elev_code, image = img), size =0.8, asp =0.5 ) +scale_color_scico(palette ="vik", direction =1,name ="Drought duration (months)",limits =c(2, 20) ) +scale_x_date(limits =c(ymd("1970-01-01"), ymd("2023-01-01")),breaks =seq.Date(from =ymd("1970-01-01"), to =ymd("2023-01-01"), by ="5 years"),date_labels ="%Y",date_minor_breaks ="1 year" ) +theme(strip.background =element_blank(),strip.text =element_text(face ="italic", hjust =0),legend.position ="bottom" ) +guides(color =guide_colorbar(title.hjust =0.5), #size =guide_legend(title.hjust =0.5) )plot_droughts``````{r}#| echo: falseggsave( plot_droughts,file ="../output/plot_drouhgts.jpg",dpi =400,width =7.09*1, height =7.09*1)```