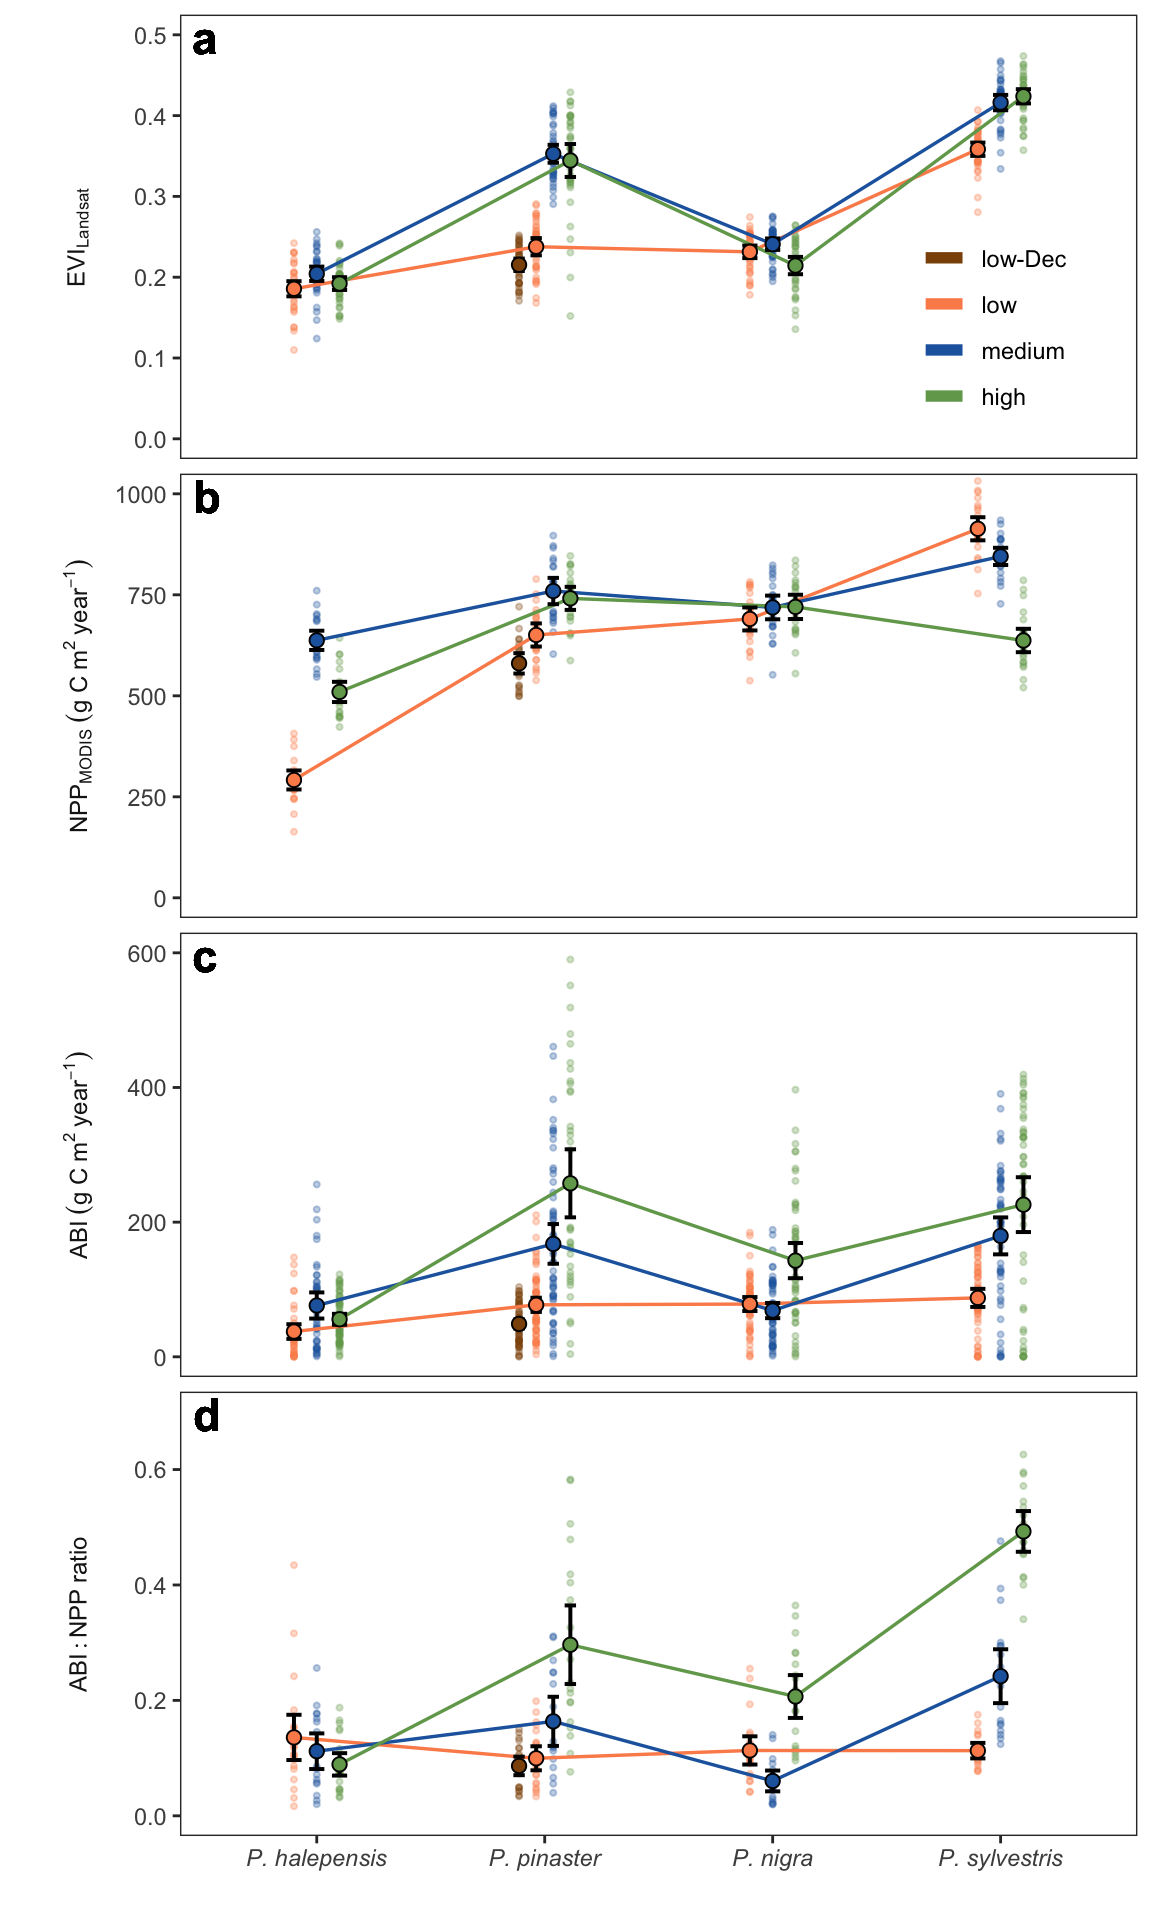
--- title: "Comparison of EVI, NPP, ABI and ABI:NPP ratio across species and elevation" format: html: toc: false execute: message: false warning: false --- - This figure corresponds to figure S4 in the manuscript.- An high-resolution version of this figure is available [ here ](../output/plot_evi_abi_npp_ratio_gradient.jpg) .### Figure ```{r} #| code-fold: true #| fig-cap: "Comparisons of the annual EVI (Enhanced Vegetation Index) (1986-2022), annual NPP (Net Primary Productivity (2001-2022), ABI (Aboveground Biomass Increment) (1952-2022) and ABI:NPP ratio (2001-2022) among species and elevation. Each small dot represents one mean annual value. Big dots represent average values. Error bars indicate 95 % confidence interval." #| fig-width: 6 #| fig-height: 10 library (tidyverse)library (emmeans)library (multcompView)library (kableExtra)source ("../scripts/aux.R" )<- read_csv ("../data/abi.csv" ) |> mutate (se = NA , sd = NA , variable = "abi" ) |> rename (mean = abi)<- read_csv ("../data/npp_modis.csv" ) |> rename (mean = npp) |> mutate (se = NA , sd = NA , variable = "npp" ) |> :: select (year, sp_code, elev_code, sp_elev, mean, sd, se, variable) <- read_csv ("../data/iv_landsat.csv" ) |> filter (iv == "evi" ) |> :: select (year, sp_code, elev_code, mean, sd, se) |> mutate (variable = "evi_landsat" )<- read_csv ("../data/ratio_abinpp.csv" ) |> :: select (year, sp_code, elev_code, sp_elev, mean = ratio) |> mutate (se = NA , sd = NA , variable = "ratio" ) <- bind_rows (|> mutate (elev_code = fct_relevel (elev_code, "low-Dec" ,"low" , "medium" , "high" )) |> mutate (Specie = paste0 ("P. " , sp_code)) |> rename (mean_y = mean, y_variable = variable)## Summary statistics # Function to generate comparisons and perform letter-based grouping <- function (model, sp_code = NULL , elev_code = NULL , alpha = 0.001 ) {<- emmeans (model, pairwise ~ sp_code * elev_code, adjust = "bonferroni" , alpha = alpha,at = list (sp_code = sp_code, elev_code = elev_code))<- multcomp:: cld (emm, Letters = letters, level = 1 - alpha)<- summary (emm, infer = TRUE )$ contrasts$ 'p.value' <- cld_df |> mutate (p_value = p_values[match (.group, cld_df$ .group)])return (result_df)<- df |> group_by (y_variable, sp_code, elev_code, sp_elev) |> summarise (mean = mean (mean_y), sd = sd (mean_y), se = sd/ sqrt (length (mean_y))) |> ungroup ()<- "evi_landsat" <- df |> filter (y_variable == variable) <- lm (mean_y ~ sp_code* elev_code, data = x) <- bind_rows (generate_comparisons (lm_evi, sp_code = "halepensis" , elev_code = c ("low" , "medium" , "high" )),generate_comparisons (lm_evi, sp_code = "pinaster" , elev_code = c ("low" , "low-Dec" , "medium" , "high" )),generate_comparisons (lm_evi, sp_code = "nigra" , elev_code = c ("low" , "medium" , "high" )),generate_comparisons (lm_evi, sp_code = "sylvestris" , elev_code = c ("low" , "medium" , "high" ))|> mutate (y_variable = variable)<- "evi_landsat" <- df |> filter (y_variable == variable) <- lm (mean_y ~ sp_code* elev_code, data = x) <- bind_rows (generate_comparisons (lm_evi, sp_code = "halepensis" , elev_code = c ("low" , "medium" , "high" )),generate_comparisons (lm_evi, sp_code = "pinaster" , elev_code = c ("low" , "low-Dec" , "medium" , "high" )),generate_comparisons (lm_evi, sp_code = "nigra" , elev_code = c ("low" , "medium" , "high" )),generate_comparisons (lm_evi, sp_code = "sylvestris" , elev_code = c ("low" , "medium" , "high" ))|> mutate (y_variable = variable)<- "abi" <- df |> filter (y_variable == variable) <- lm (mean_y ~ sp_code* elev_code, data = x) <- bind_rows (generate_comparisons (lm_abi, sp_code = "halepensis" , elev_code = c ("low" , "medium" , "high" )),generate_comparisons (lm_abi, sp_code = "pinaster" , elev_code = c ("low" , "low-Dec" , "medium" , "high" )),generate_comparisons (lm_abi, sp_code = "nigra" , elev_code = c ("low" , "medium" , "high" )),generate_comparisons (lm_abi, sp_code = "sylvestris" , elev_code = c ("low" , "medium" , "high" ))|> mutate (y_variable = variable)<- "npp" <- df |> filter (y_variable == variable) <- lm (mean_y ~ sp_code* elev_code, data = x) <- bind_rows (generate_comparisons (lm_npp, sp_code = "halepensis" , elev_code = c ("low" , "medium" , "high" )),generate_comparisons (lm_npp, sp_code = "pinaster" , elev_code = c ("low" , "low-Dec" , "medium" , "high" )),generate_comparisons (lm_npp, sp_code = "nigra" , elev_code = c ("low" , "medium" , "high" )),generate_comparisons (lm_npp, sp_code = "sylvestris" , elev_code = c ("low" , "medium" , "high" ))|> mutate (y_variable = variable)<- "ratio" <- df |> filter (y_variable == variable) <- lm (mean_y ~ sp_code* elev_code, data = x) <- bind_rows (generate_comparisons (lm_ratio, sp_code = "halepensis" , elev_code = c ("low" , "medium" , "high" )),generate_comparisons (lm_ratio, sp_code = "pinaster" , elev_code = c ("low" , "low-Dec" , "medium" , "high" )),generate_comparisons (lm_ratio, sp_code = "nigra" , elev_code = c ("low" , "medium" , "high" )),generate_comparisons (lm_ratio, sp_code = "sylvestris" , elev_code = c ("low" , "medium" , "high" ))|> mutate (y_variable = variable)<- bind_rows (means_letters_lm_abi, means_letters_lm_evi, means_letters_lm_npp, means_letters_lm_ratio) |> ungroup ()<- df_avg |> inner_join (df_letters) |> mutate (pvalue = ifelse (p_value < 0.0001 , "<0.0001" , round (p_value, 3 ))) ## Figure <- df |> mutate (sp_code = fct_relevel (sp_code, "halepensis" ,"pinaster" , "nigra" , "sylvestris" )) |> mutate (variable2 = case_when (== "abi" ~ "ABI~(g~C~m^2~year^{-1})" , == "npp" ~ "NPP[MODIS]~(g~C~m^2~year^{-1})" ,== "evi_landsat" ~ "EVI[Landsat]" ,== "ratio" ~ "ABI:NPP~ratio" |> mutate (Species = paste0 ("P. " , sp_code)) |> ungroup () <- out |> mutate (sp_code = fct_relevel (sp_code, "halepensis" ,"pinaster" , "nigra" , "sylvestris" )) |> mutate (variable2 = case_when (== "abi" ~ "ABI~(g~C~m^2~year^{-1})" , == "npp" ~ "NPP[MODIS]~(g~C~m^2~year^{-1})" ,== "evi_landsat" ~ "EVI[Landsat]" ,== "ratio" ~ "ABI:NPP~ratio" |> ungroup () <- list (scale_y_continuous (limits = c (0 , 0.5 )),scale_y_continuous (limits = c (0 ,1000 )),scale_y_continuous (limits = c (0 , 600 )), scale_y_continuous (limits = c (0 ,.7 ))<- data.frame (variable2 = c ("EVI[Landsat]" , "NPP[MODIS]~(g~C~m^2~year^{-1})" ,"ABI~(g~C~m^2~year^{-1})" ,"ABI:NPP~ratio" ), label = c ("a" , "b" , "c" , "d" ),x = c (- Inf , - Inf , - Inf , - Inf ), y = c (Inf , Inf , Inf , Inf ) # Inf to put at upper = position_dodge (width = 0.3 )<- out_plot |> inner_join (letras_indicativo_plot, by= "variable2" ) |> mutate (Species = paste0 ("P. " , sp_code)) |> mutate (Species = fct_relevel (Species, "P. halepensis" ,"P. pinaster" , "P. nigra" , "P. sylvestris" )) <- c ("low-Dec" = "#8c510a" ,"low" = "#fc8d59" ,"medium" = "#2166ac" ,"high" = "#72A55A" )<- ggplot (data = out_plot2, aes (y = mean, x = Species, group = elev_code, colour = elev_code)) + geom_jitter (data = df_plot,aes (y = mean_y, x = Species, group = elev_code, colour = elev_code), alpha = 0.3 , size = .75 , stroke = 0.5 , position = custom_position, show.legend = FALSE ) + geom_line (position = custom_position, size = .6 ) + geom_errorbar (aes (ymin= mean-1.96 * se, ymax= mean+1.96 * se), colour = "black" , width= .2 , lwd = .7 , position = custom_position) + geom_point (size = 2.2 , position = custom_position, aes (fill = elev_code, group = elev_code),shape = 21 , colour = "black" , stroke = 0.5 , show.legend = FALSE ) + facet_wrap (~ factor (variable2, c ("EVI[Landsat]" , "NPP[MODIS]~(g~C~m^2~year^{-1})" ,"ABI~(g~C~m^2~year^{-1})" ,"ABI:NPP~ratio" )),scales = "free_y" , labeller = label_parsed, strip.position = "left" ,ncol = 1 ) + theme_bw () + theme (panel.grid = element_blank (),strip.background = element_blank (),strip.placement = "outside" ,legend.position = c (0.85 , 0.84 ),legend.background = element_blank (),axis.text.x = element_text (face = "italic" ),strip.text = element_text (face = "bold" , size = 9 )+ scale_colour_manual (values = colours_elev, name = "" , guide = guide_legend (override.aes = list (linewidth = 2 ))) + scale_fill_manual (values = colours_elev, name = "" ) + xlab ("" ) + ylab ("" ) + :: facetted_pos_scales (y = y_scales) + geom_text (aes (label = label, x = x, y = y), vjust = 1.2 , hjust = - .5 , size = 6 , fontface = "bold" , inherit.aes = FALSE )# custom scales ``` ```{r} #| code-fold: true #| fig-cap: "Comparison table" #| fig-width: 6 #| fig-height: 10 |> ungroup () |> :: select (- sp_elev) |> :: select (- p_value) |> arrange (y_variable, sp_code, elev_code) |> kbl (digits = c (0 ,0 ,0 ,3 ,3 ,3 , 3 ,3 ,0 ,3 ,3 ,0 ,5 ), caption = "Posthoc differences within species for average ABI, EVI, NPP" ) |> kable_paper ("hover" , full_width = F)``` ```{r} #| echo: false ggsave (file = "../output/plot_evi_abi_npp_ratio_gradient.jpg" ,dpi = 400 ,width = 7.09 * 1.3 * .58 , height = 7.09 * 1.3 * 1 ``` 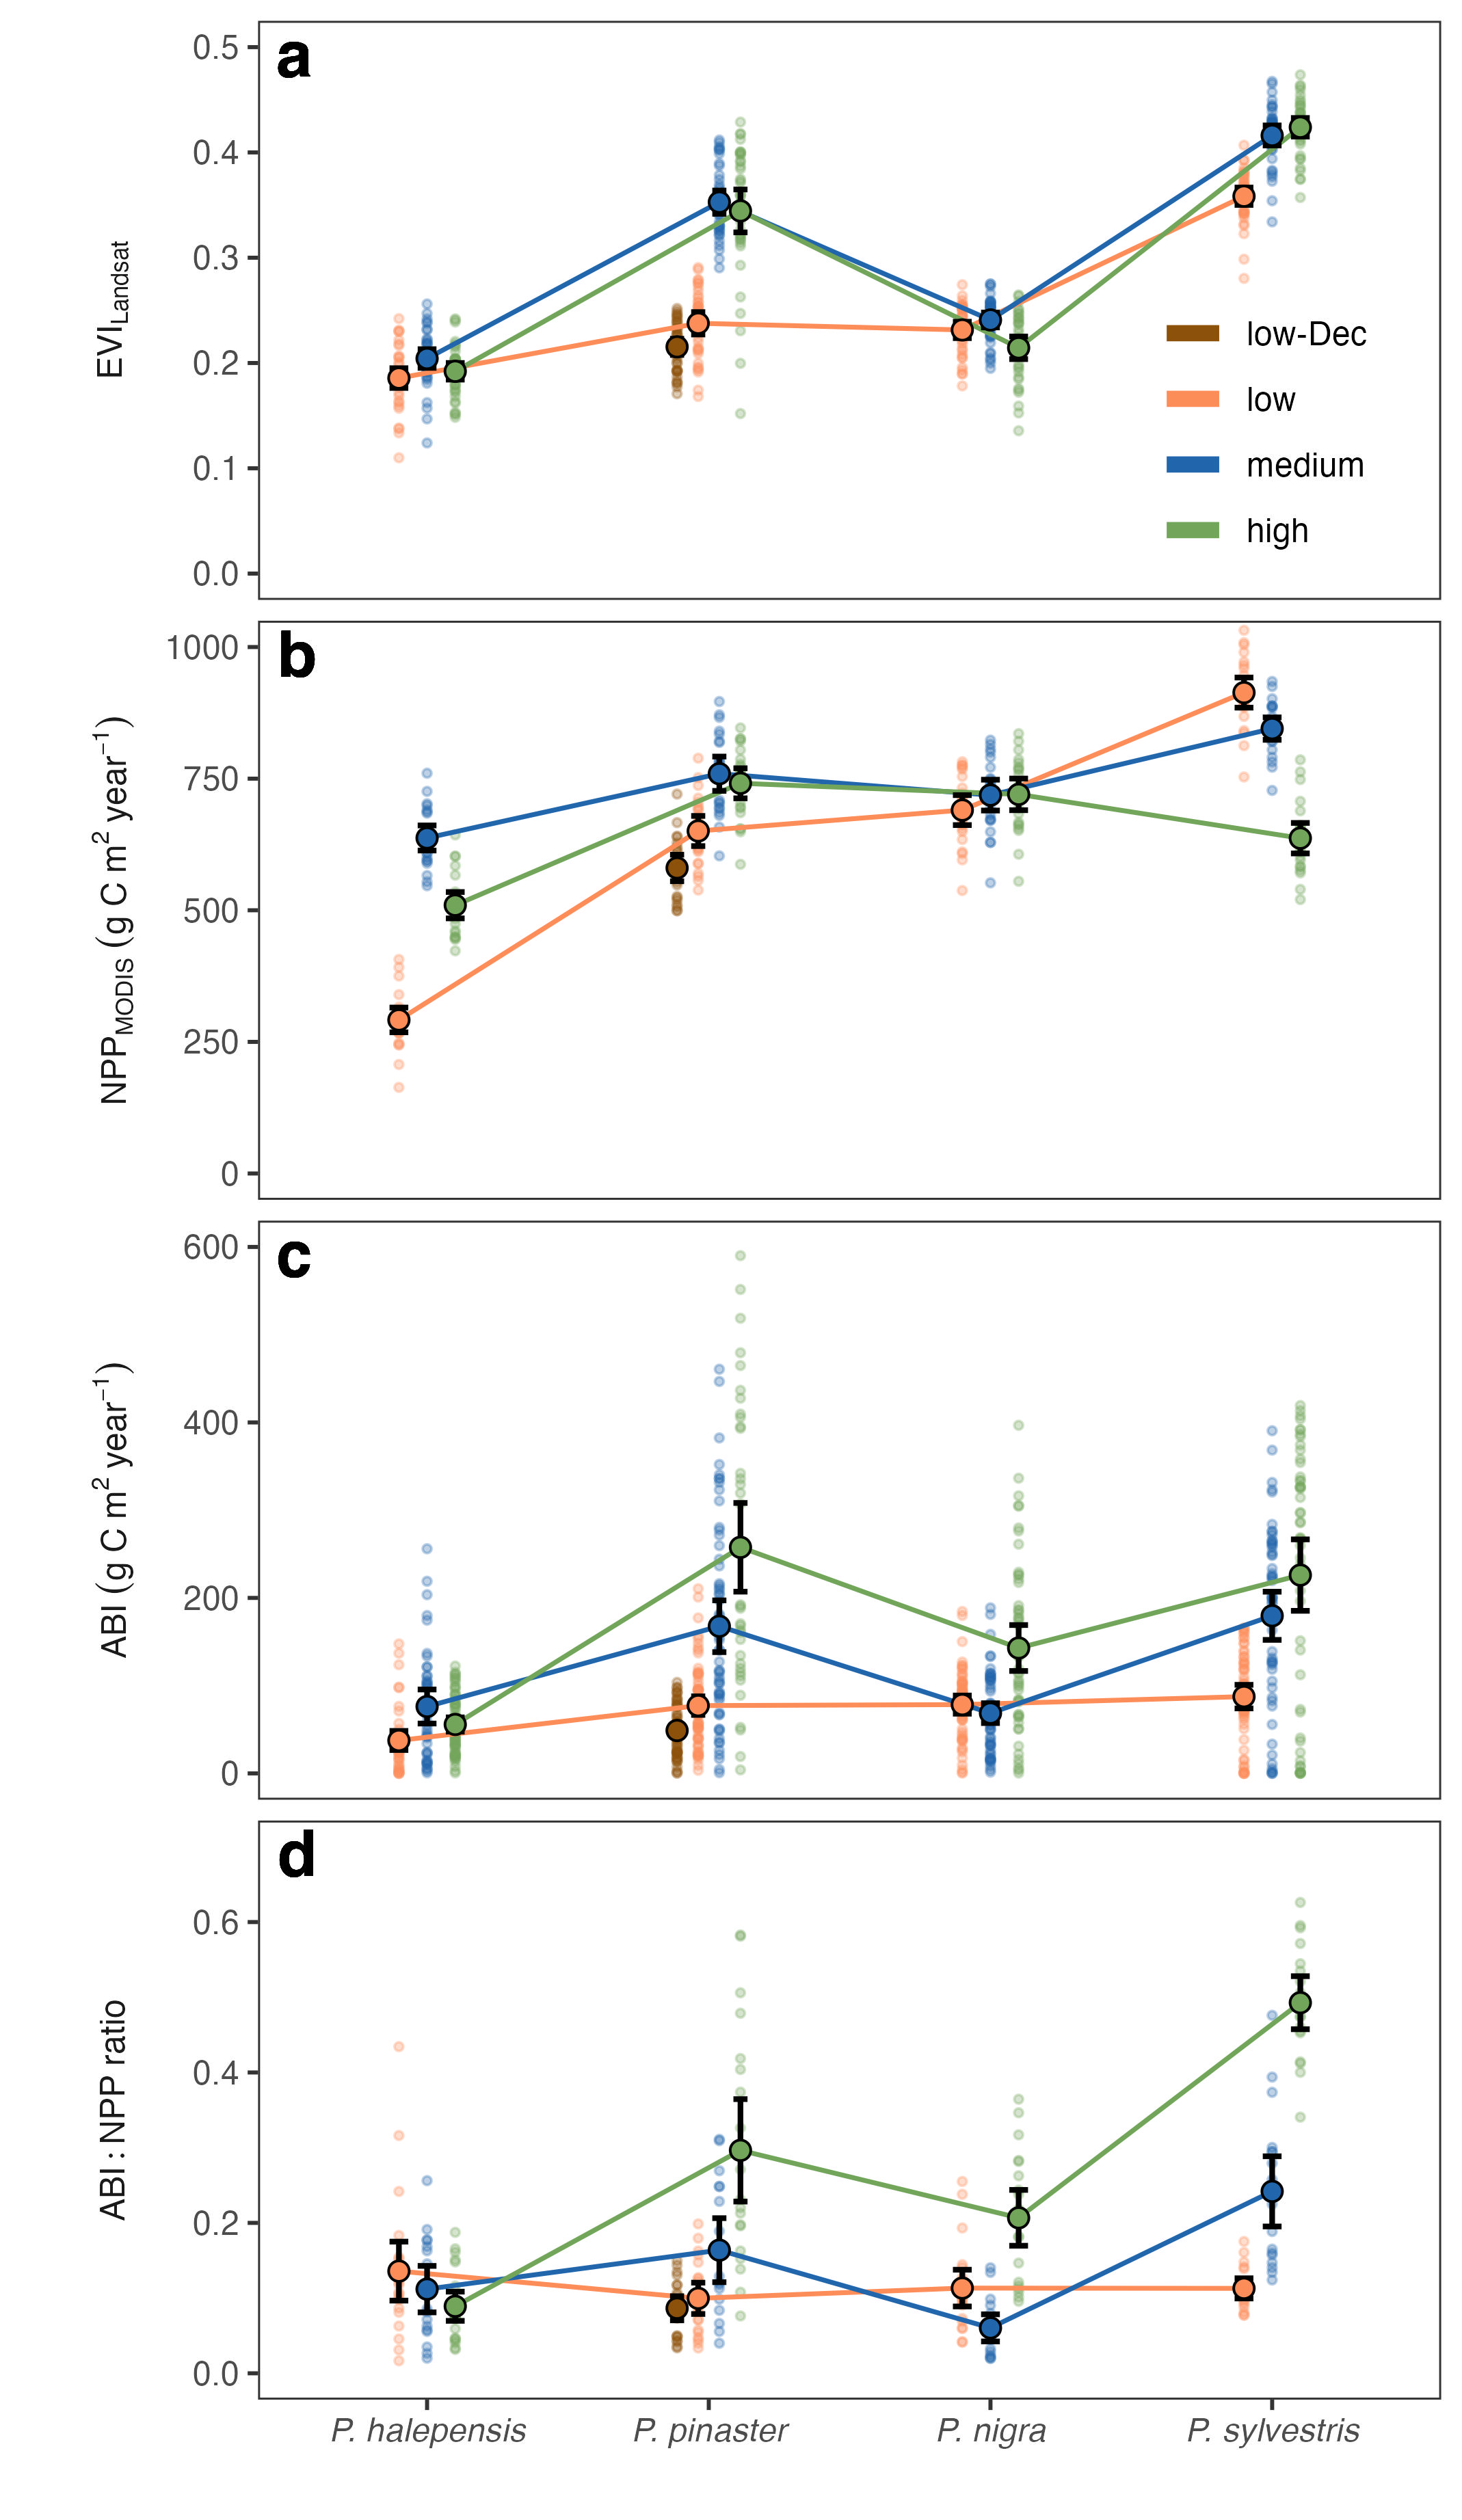