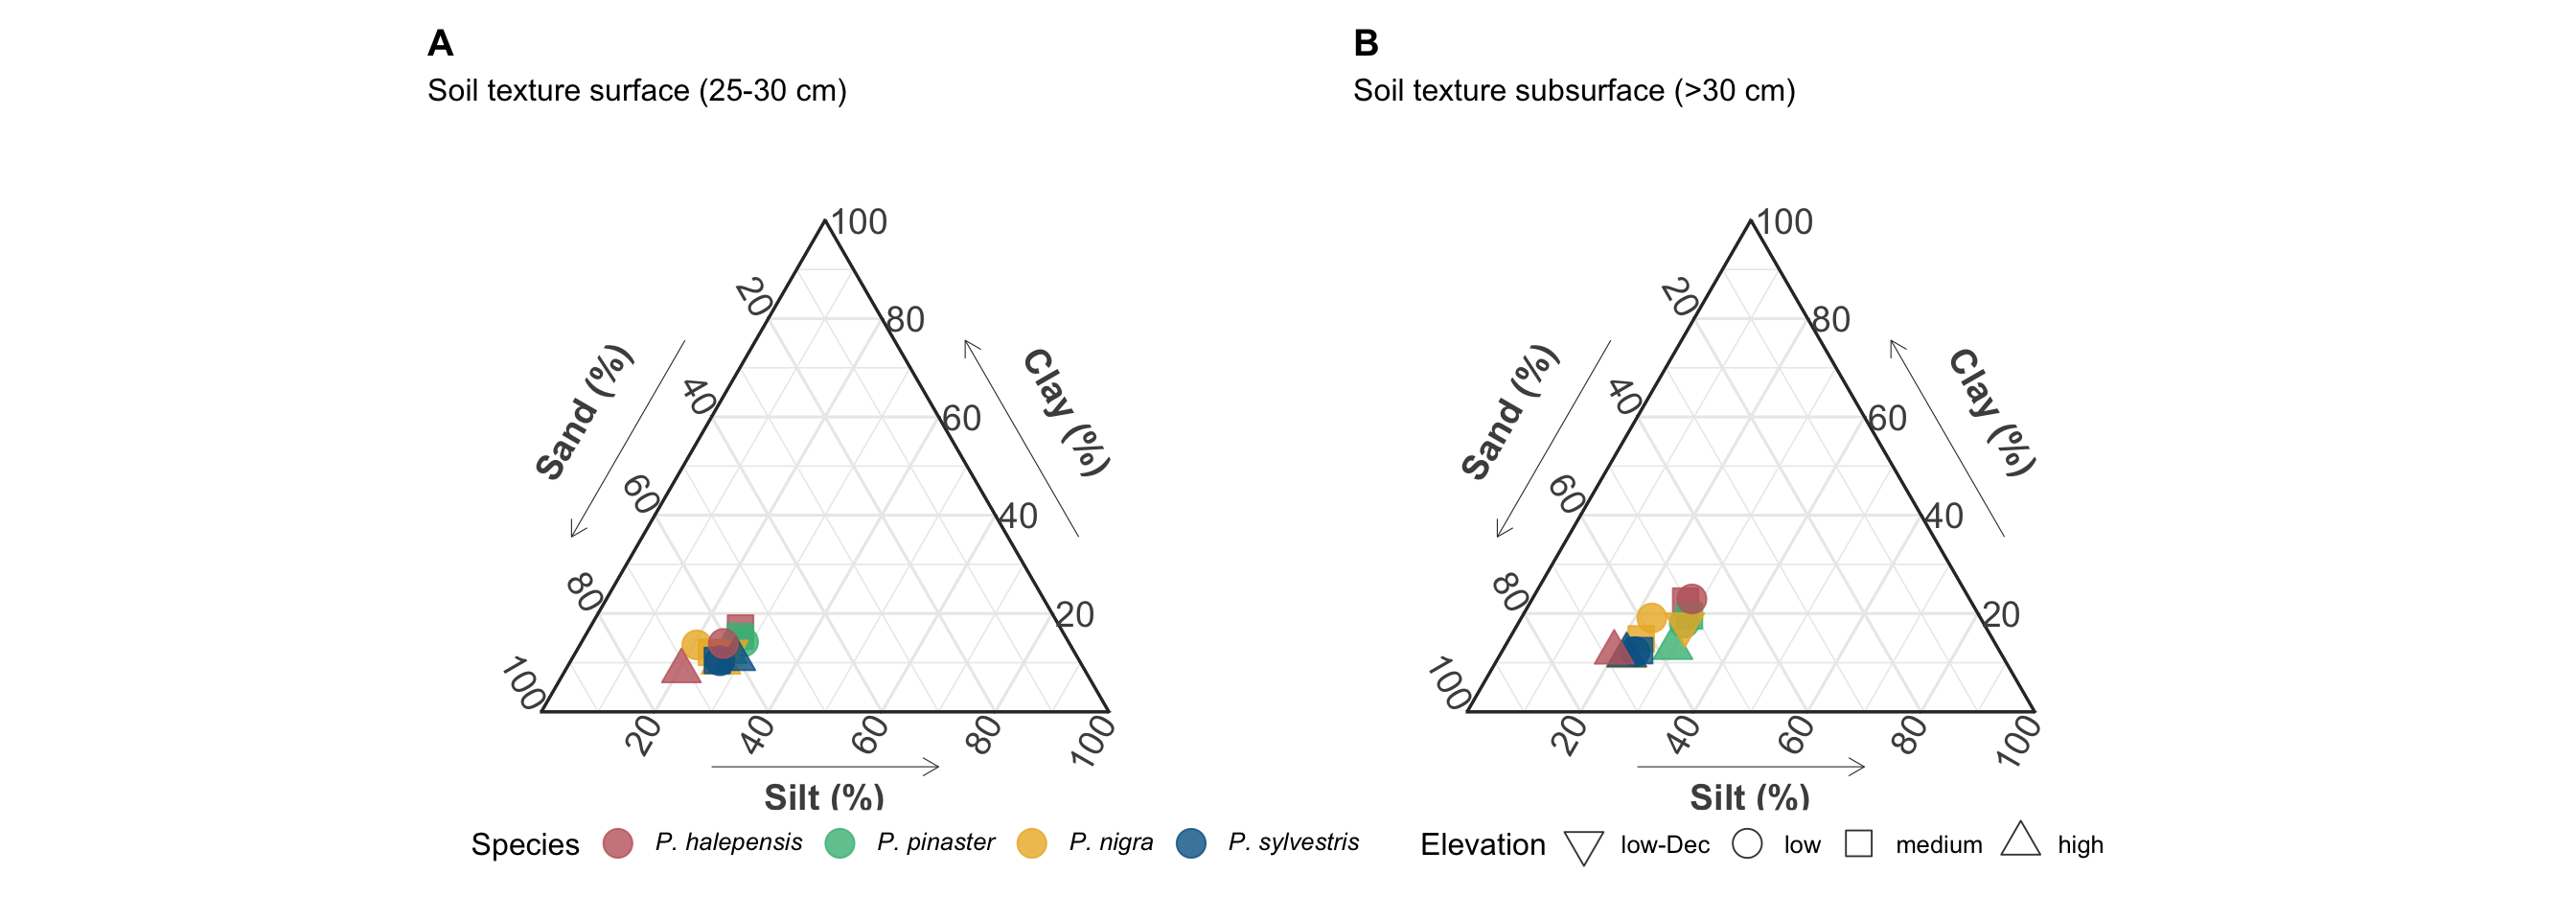
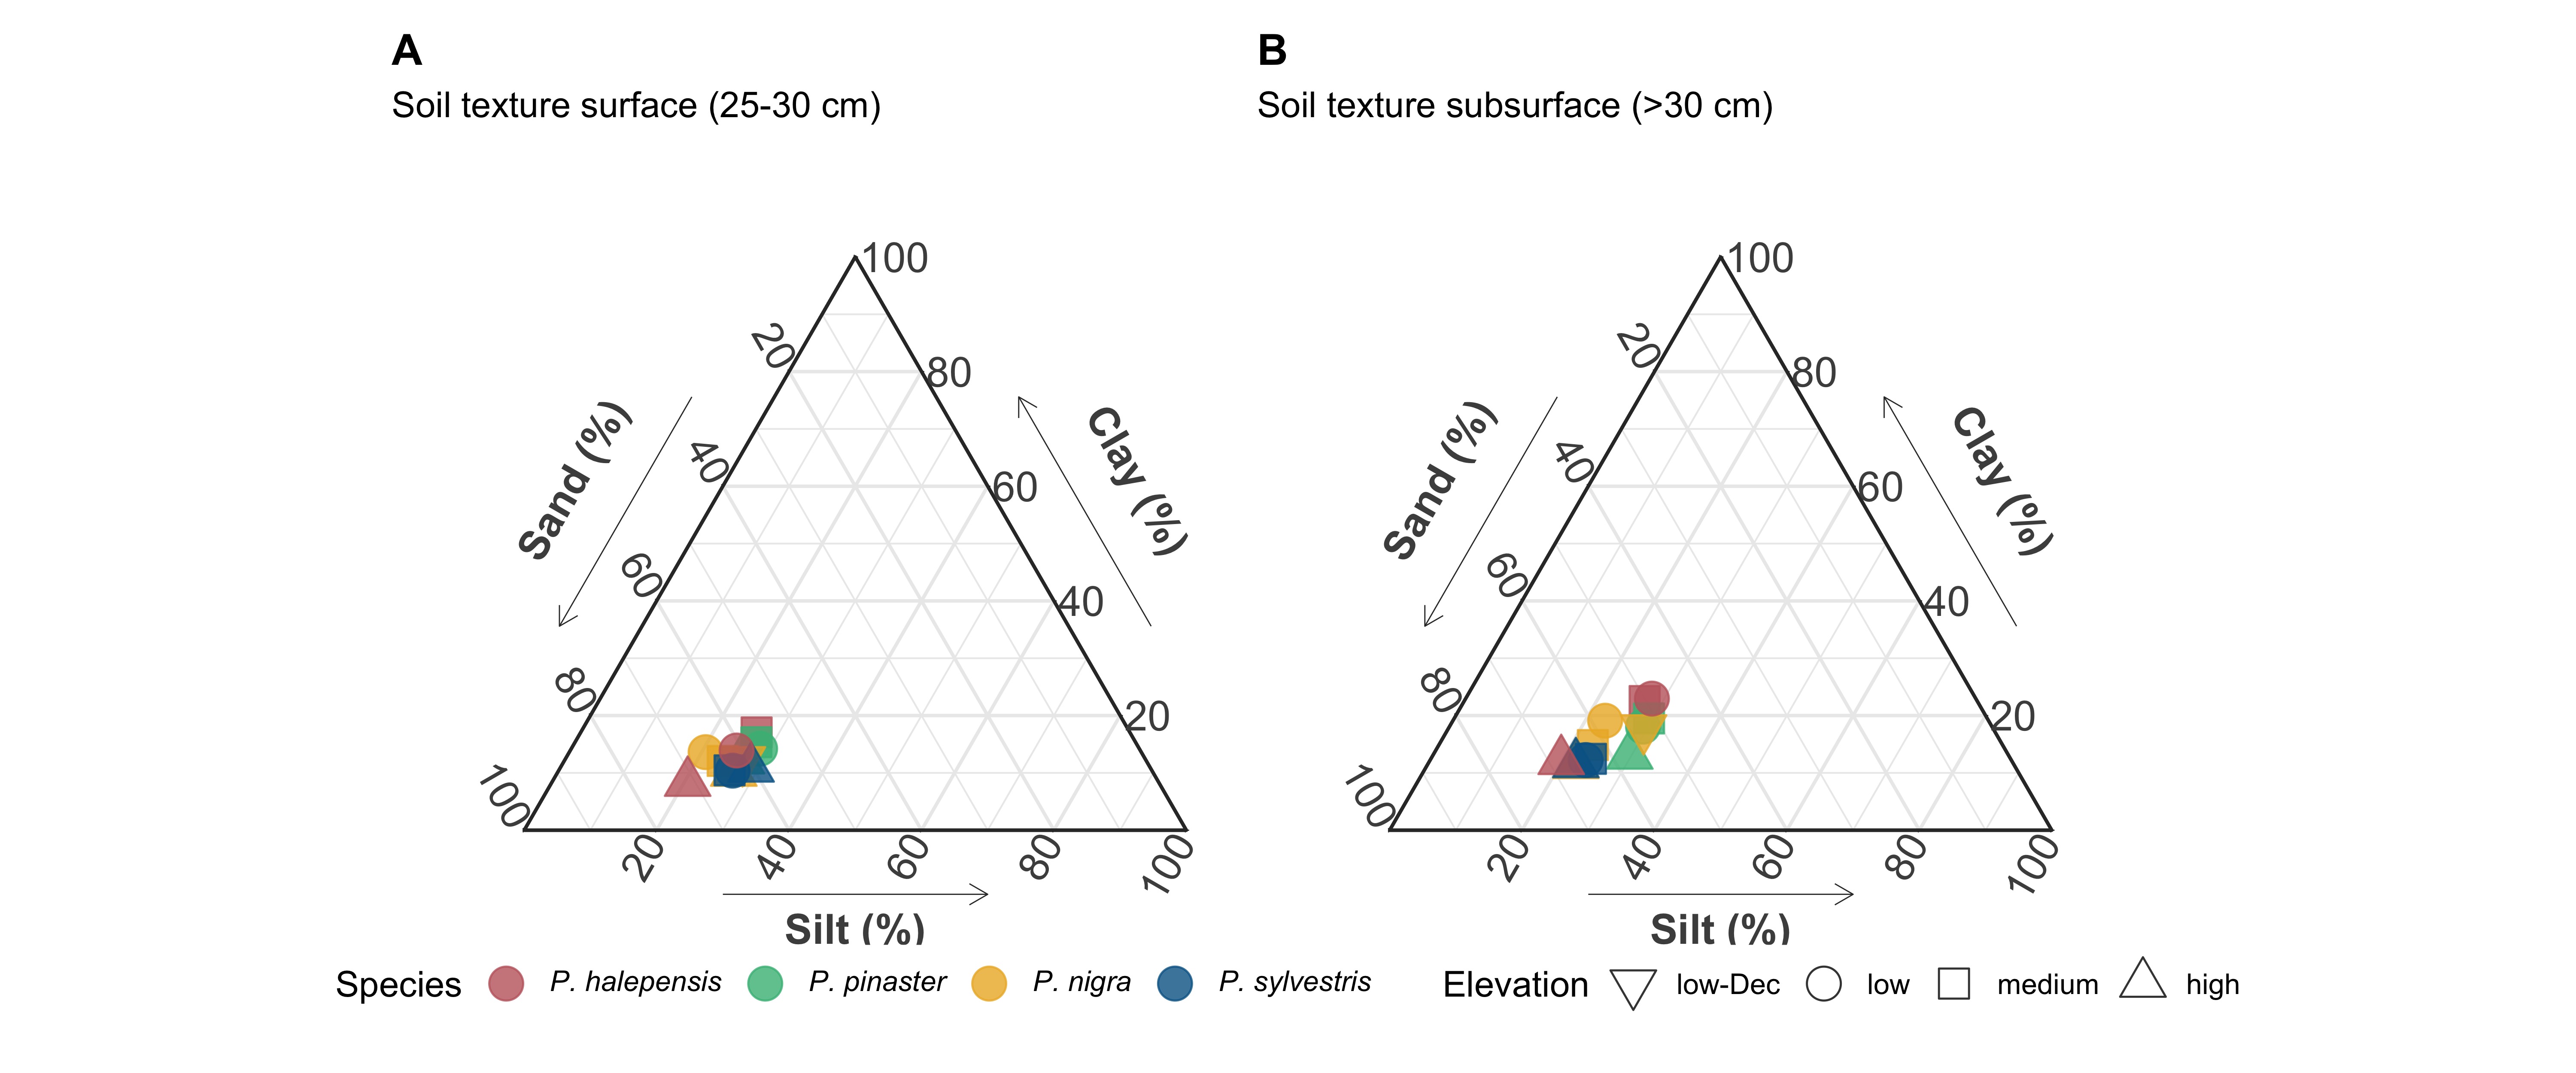
Ternary soil maps showing percent composition of sand, clay and silt of the studied sites, for surface (up to 25-30 cm depth) (a) and subsurface (> 30 cm depth) soils (b).
Source Code
---title: "Soil features of the sampling sites"format: html: toc: falseexecute: message: false warning: false---- This figure corresponds to figure S8 in the manuscript.- An high-resolution version of this figure is available [here](../output/soil_ternary.jpg).```{r}#| code-fold: true#| fig-cap: "Ternary soil maps showing percent composition of sand, clay and silt of the studied sites, for surface (up to 25-30 cm depth) (a) and subsurface (> 30 cm depth) soils (b)."#| fig-width: 14library(tidyverse)library(ggtern)library(patchwork)library(gridExtra)library(lemon)source("../scripts/aux.R")### Physico-Chemical features #### Texture soil_fq <-read_csv("../data/soil_data.csv") |>mutate(species =paste0("P. ", sp_code)) |>mutate(elev_code =case_when( elev_code =="low2"~"low-Dec", TRUE~ elev_code )) |>mutate(elev_code =fct_relevel(elev_code, "low-Dec", "low", "medium", "high")) |>mutate(sp_code =fct_relevel(sp_code, "halepensis","pinaster", "nigra", "sylvestris")) # Plots parameters custom_theme <-list(labs(yarrow ="Clay (%)",zarrow ="Silt (%)", xarrow ="Sand (%)"),theme_bw(), ggplot2::xlab(""), ggplot2::ylab(""), ggtern::zlab(""),theme_showarrows(),theme_showgrid(),scale_shape_manual(values = shape_elev, name ="Elevation"),scale_colour_manual(values = colours_Specie, labels =expression(italic("P. halepensis"), italic("P. pinaster"), italic("P. nigra"), italic("P. sylvestris")), name ="Species"),scale_fill_manual(values = colours_Specie, labels =expression(italic("P. halepensis"), italic("P. pinaster"), italic("P. nigra"), italic("P. sylvestris")),name ="Species"),# tern_limits(T=0.4, L = 0.8, R=0.5) tern_limits(T=1, L =1, R=1),theme(tern.axis.arrow.text =element_text(size =14, face ="bold"), tern.axis.arrow.text.T =element_text(vjust =-1), # claytern.axis.arrow.text.L =element_text(vjust =-1), # sandtern.axis.arrow.text.R =element_text(vjust =1), # silttern.axis.text =element_text(size =14),plot.title =element_text(face ="bold") ))gsup <- soil_fq |>filter(type =="Textura Superficial") |> dplyr::select(-res, -layer, -type) |>pivot_wider(values_from = value, names_from = soil_var)plot_sup <-ggtern(data = gsup, aes(x = arena_sup, y = arcilla_sup, z = limo_sup, color = species, fill = species)) +geom_point(size =5, aes(shape = elev_code), alpha =0.8) +ggtitle("A", subtitle ="Soil texture surface (25-30 cm)") + custom_theme gsub <- soil_fq |>filter(type =="Textura Subsuperficial") |> dplyr::select(-res, -layer, -type) |>pivot_wider(values_from = value, names_from = soil_var)plot_sub <-ggtern(data = gsub, aes(x = arena_sub, y = arcilla_sub, z = limo_sub, color = species, fill = species)) +geom_point(size =5, aes(shape = elev_code), alpha =0.8) +ggtitle("B", subtitle ="Soil texture subsurface (>30 cm)") + custom_themecommon_legend <- lemon::g_legend(plot_sub +theme(legend.position ="bottom",legend.background =element_blank()))combined_ggtern <- ggtern::grid.arrange(plot_sup +theme(legend.position ="hidden",plot.margin =unit(c(t=0.4, r=-5, b=-.6, l=0), "cm")), plot_sub +theme(legend.position ="hidden",plot.margin =unit(c(t=0.4, r=0, b=-.6, l=-5), "cm")), common_legend,# nrow = 1, # widths = c(2,2,0.5),layout_matrix =matrix(c(1, 3, 2, 3), nrow =2), heights =c(5,1))``````{r}#| echo: falseggsave(combined_ggtern, filename ="../output/soil_ternary.jpg",dpi =500, width =12, height =5)```